
The Retail Deduction Recovery Workbook is a free Excel file with eight sheets and 2,000+ formulas. The Dispute Tracker auto-calculates days remaining and a priority score for each case. Shortage Reconciliation computes quantity gaps across four handoff points and flags the first divergence. The Dashboard pulls live totals by retailer, deduction type, and root cause with no manual entry. Every formula works in Google Sheets.
Pixels and Clicks free resource, November 2026. Retailer deadlines compiled from independent vendor sources and Pixels and Clicks articles. Verify against the live retailer portal.
A $4,200 shortage claim from Walmart hits your remittance on a Tuesday. Your team pulls the POD, confirms the truck arrived, and opens a dispute, but Walmart denies it. Your ASN quantity didn’t match your pick ticket, and your team didn’t check before filing.
That claim is now a write-off. The evidence existed in four systems. Unfortunately, your team didn’t assemble it before the deadline closed.
This workbook exists so you don’t lose that claim again. It’s a single Excel file with eight sheets and 2,003 formulas. You enter a deduction. The workbook calculates your deadline countdown, flags your evidence gaps, scores the case by urgency, and rolls everything into a dashboard you review monthly.
There are no macros, no VBA, and nothing to log into. Download the workbook and open it.
What’s inside
There are eight sheets, each with a specific job. The first five are where you enter data. The Dashboard reads from them automatically. The Deadline Reference is a static lookup.
| Sheet | What you enter | What it calculates |
|---|---|---|
| Dispute Tracker | Case ID, retailer, amount, clock-start date, deadline days | Portal deadline, days remaining, priority score (0-10), recovery % |
| Evidence Checklist | Which of 16 documents you’ve located and verified per case | Completeness % per case |
| Shortage Reconciliation | Ordered, picked, ASN’d, received, and invoiced quantities | Four gap columns, first point of divergence |
| OTIF Timestamp Log | Source timestamps for each shipment milestone | Delta hours between consecutive milestones |
| Root Cause Register | Operational cause, corrective action, owner | The Dashboard reads from it |
| Dashboard | Nothing. Don’t type in this sheet. | Everything: exposure, recovery rate, aging, breakdowns by retailer, type, root cause |
| Deadline Reference | Nothing. Pre-filled. | Static lookup with hyperlinks to source articles |
Dispute Tracker
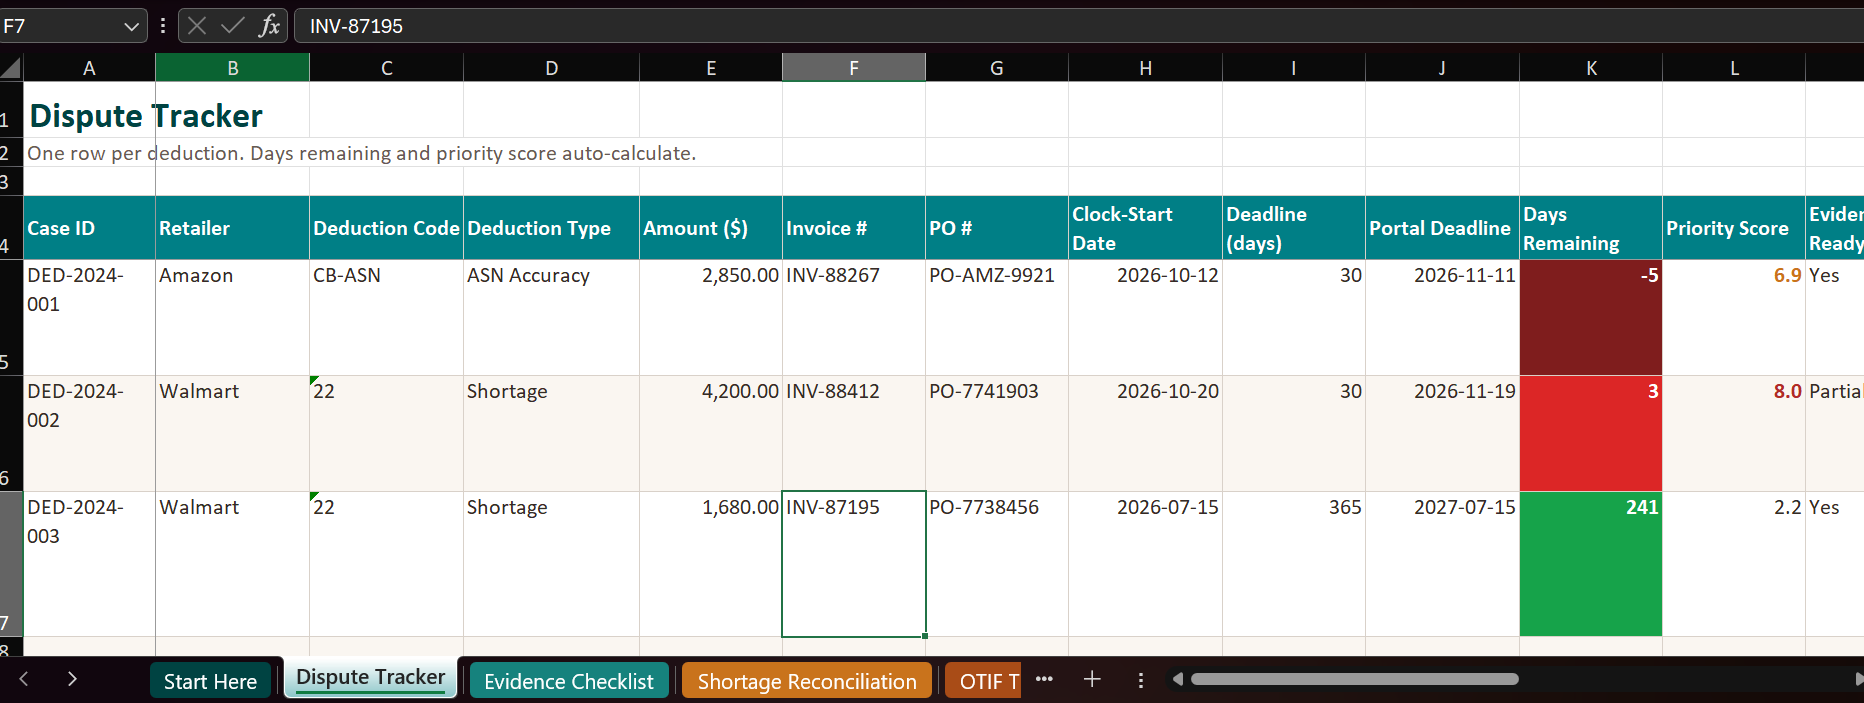
This is the master log. You have one row per deduction.
You enter the case ID, retailer (dropdown), deduction code, type (dropdown: Shortage, OTIF, ASN Accuracy, Pricing, Compliance, Returns), amount, invoice number, PO number, clock-start date, and deadline in days.
Four columns auto-calculate from your entries.
Portal Deadline
Formula: Clock-Start Date + Deadline (days).
If you enter 2026-11-01 as the clock-start date and 30 as the deadline, the portal deadline shows 2026-12-01. This is a working estimate. Always verify against the live portal.
Days Remaining
Formula: Portal Deadline - TODAY().
This number updates every time you open the file. Negative numbers mean the deadline has passed.
The cell fills with a color based on urgency, with white text for contrast. The further past the deadline, the darker the red:
| Cell color | Meaning |
|---|---|
| Green | 30 or more days remaining |
| Orange | 7 to 29 days remaining |
| Red | Fewer than 7 days remaining |
| Dark red | Deadline already passed (negative number) |
Priority Score
A 0-to-10 urgency score. Three weighted factors:
| Factor | Weight | How it scores |
|---|---|---|
| Amount | 30% | Scales from 0 to 3 based on dollar value (caps at $3,000+) |
| Days remaining | 40% | 4.0 if overdue. 3.5 if under 7 days. 3.0 if under 14. 2.0 if under 30. 1.0 if under 60. 0.5 beyond. |
| Evidence readiness | 30% | 0 if complete. 1.5 if partial. 3.0 if not started. |
A $5,000 deduction due in 3 days with no evidence gathered scores 10. A $200 deduction due in 90 days with complete evidence scores 0.7. Work the high numbers first.
Scores above 7 show in red text, and scores above 4 in amber.
Other columns
Evidence Ready, Decision, Date Submitted, Current Status, Outcome, Recovered Amount, Root Cause, Owner, and Notes are manual entry. Columns with a fixed set of values use dropdown lists.
Recovery % auto-calculates: Recovered Amount / Deduction Amount.
Dropdown reference
| Column | Options |
|---|---|
| Retailer | Walmart, Target, Amazon, Kroger, Home Depot, Costco, Other |
| Deduction Type | Shortage, OTIF, ASN Accuracy, Pricing, Compliance, Returns, Other |
| Evidence Ready | Yes, No, Partial |
| Decision | Dispute, Investigate, Accept, Write Off |
| Current Status | Open, Submitted, Awaiting Response, Additional Docs Requested, Won, Lost, Partial, Written Off |
| Outcome | Recovered, Partially Recovered, Denied, Written Off, Pending |
How to use it
- Open the Dispute Tracker when a new deduction posts on your remittance or shows up in the retailer portal.
- Enter one row per deduction line. Fill in Case ID through Deadline (days).
- Check the Days Remaining column. Work anything red or yellow first.
- Sort by Priority Score to triage your open cases.
- Update Status and Outcome as the dispute progresses.
- Enter the Recovered Amount when it resolves. Recovery % fills in automatically.
Evidence Checklist
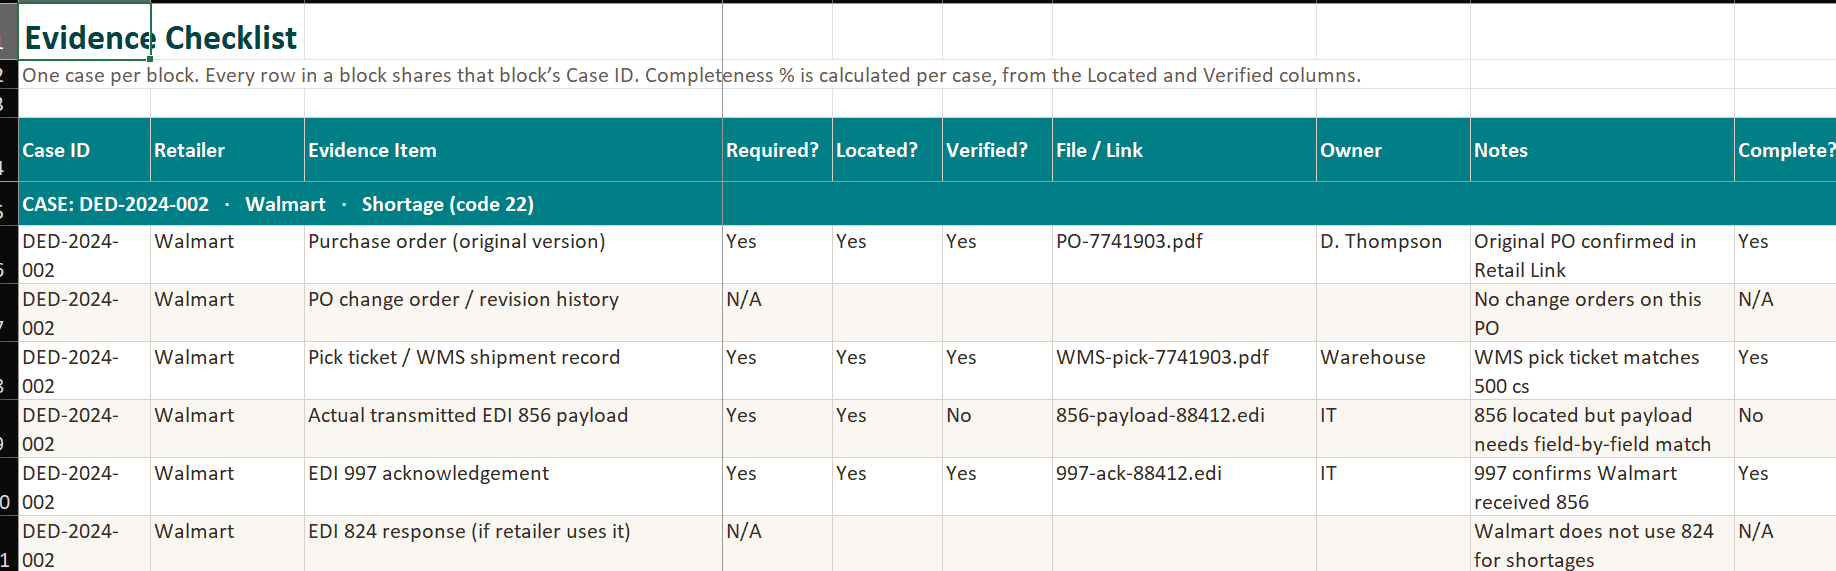
Each case needs up to 16 documents before you file a dispute. This sheet tracks which ones you’ve gathered and verified.
The sheet is organized in blocks. Each block covers one case: a case header that carries the Case ID, 16 rows (one per evidence item), and a completeness row. Every row in a block shares that block’s Case ID, so one block is always one case.
Columns
| Column | What to enter |
|---|---|
| Case ID | Same case ID from the Dispute Tracker |
| Retailer | Dropdown |
| Evidence Item | Pre-filled. Don’t change these. |
| Required? | Yes, No, or N/A. Mark N/A for items that don’t apply to this deduction type. |
| Located? | Yes or No. Have you found the document? |
| Verified? | Yes or No. Have you checked the document’s content against the claim? |
| File / Link | Where the document lives (filename, path, or portal link) |
| Owner | Who is responsible for gathering this document |
Auto-calculated columns
Complete? shows Yes if both Located and Verified are Yes. Shows N/A if the item was marked N/A. Shows No otherwise.
Completeness (the row below each case block) shows a percentage and count. “58% (7 of 12 required items complete)” means 7 of the 12 items that apply to this case are both located and verified. Items you marked N/A drop out of the count, so the denominator is only the items that actually apply.
How to use it
- Copy the first case block for each new case. The formulas copy with it.
- Set Required to N/A for anything that doesn’t apply. A pricing dispute doesn’t need a POD. An OTIF dispute doesn’t need a trade agreement.
- Update Located and Verified as documents come in.
- Don’t file a dispute until the completeness row reads 100%.
The workbook ships with three pre-formatted case blocks. If you need more, copy a block and paste it below.
Shortage Reconciliation
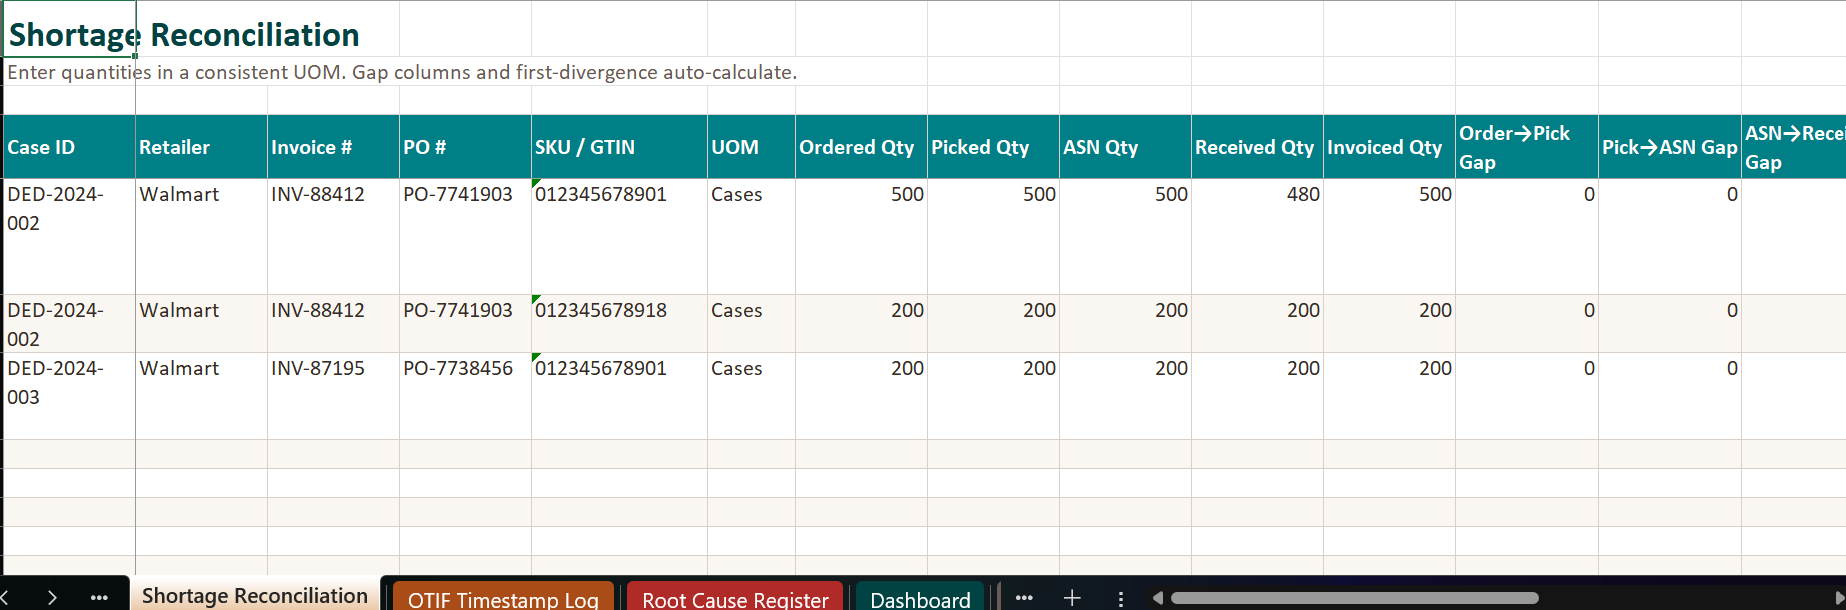
Shortage claims are the most common deduction type. The root cause hides in the quantity gap between two adjacent handoff points. This sheet finds it.
Columns you fill in
Case ID, Retailer, Invoice, PO, SKU/GTIN, UOM, and five quantities: Ordered, Picked, ASN’d, Received, Invoiced.
All quantities must use the same unit of measure. If your PO is in cases and your ASN is in eaches, convert before entering.
Auto-calculated columns
| Column | Formula | What it means |
|---|---|---|
| Order to Pick Gap | Picked minus Ordered | Negative means short pick. Positive means over pick. |
| Pick to ASN Gap | ASN’d minus Picked | Non-zero means the ASN doesn’t match what left your dock. |
| ASN to Received Gap | Received minus ASN’d | Negative means the retailer says fewer units arrived. |
| Received to Invoice Gap | Invoiced minus Received | Positive means you billed more than the retailer counted. |
| First Divergence | First non-zero gap | Tells you where to investigate and what to check. |
Any non-zero gap turns red text. The First Divergence column gives you a plain-language instruction:
- “Order to Pick: check warehouse/inventory”
- “Pick to ASN: check 856 generation/mapping”
- “ASN to Received: check carrier/delivery/receiving”
- “Received to Invoice: check billing/UOM”
- “No discrepancy found” if all gaps are zero
How to use it
- Pull quantities from each source system. Use the actual EDI 856 payload, not your ERP shipment screen. Use the retailer’s receiving record, not your delivery confirmation.
- Enter all five quantities on one row.
- Read the gap columns left to right. The first red cell is your investigation starting point.
- Use the First Divergence column to decide who to talk to and what evidence to pull.
OTIF Timestamp Log
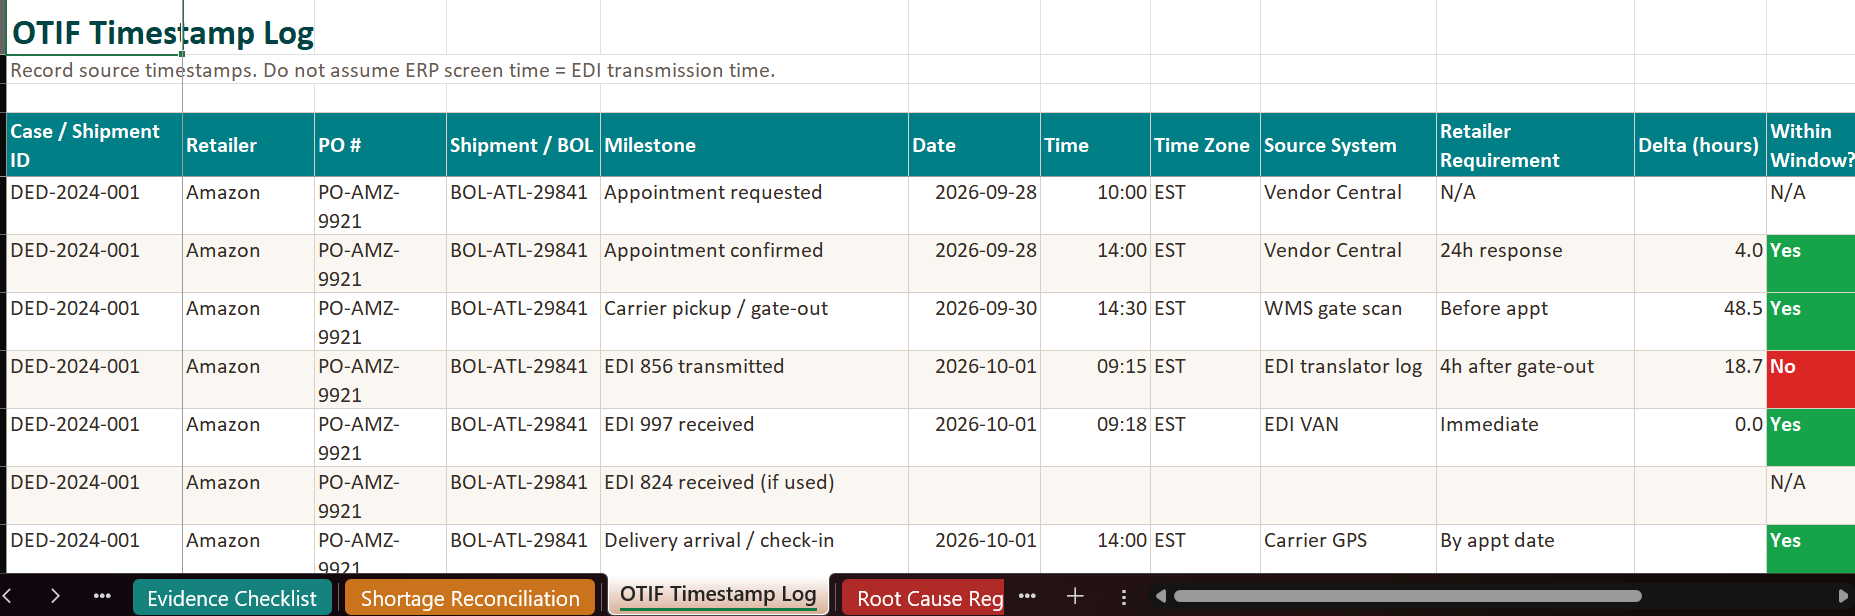
OTIF disputes need a timeline, not a general explanation. This sheet builds one.
Each shipment gets a block of eight rows, one per milestone:
- Appointment requested
- Appointment confirmed
- Carrier pickup / gate-out
- EDI 856 transmitted
- EDI 997 received
- EDI 824 received (if used)
- Delivery arrival / check-in
- Retailer receipt / unload complete
Columns you fill in
Case/Shipment ID, Retailer, PO, Shipment/BOL. Then for each milestone: Date, Time, Time Zone, Source System, Retailer Requirement, Within Window (dropdown: Yes, No, N/A), and Evidence File.
Auto-calculated column
Delta (hours) shows the time elapsed between consecutive milestones. Formula: (current milestone date + time) minus (previous milestone date + time) times 24. Displays hours with one decimal place.
How to use it
- Pull timestamps from the source systems, not from your ERP’s summary view. The timestamp in NetSuite or Business Central is often when the record was created in your system. That’s different from when the EDI file transmitted.
- Record the time zone. A delivery at 2:00 PM ET is different from 2:00 PM CT if the retailer’s appointment window is in local time.
- Compare each milestone against the retailer’s specific requirement for that shipment type and program.
Root Cause Register
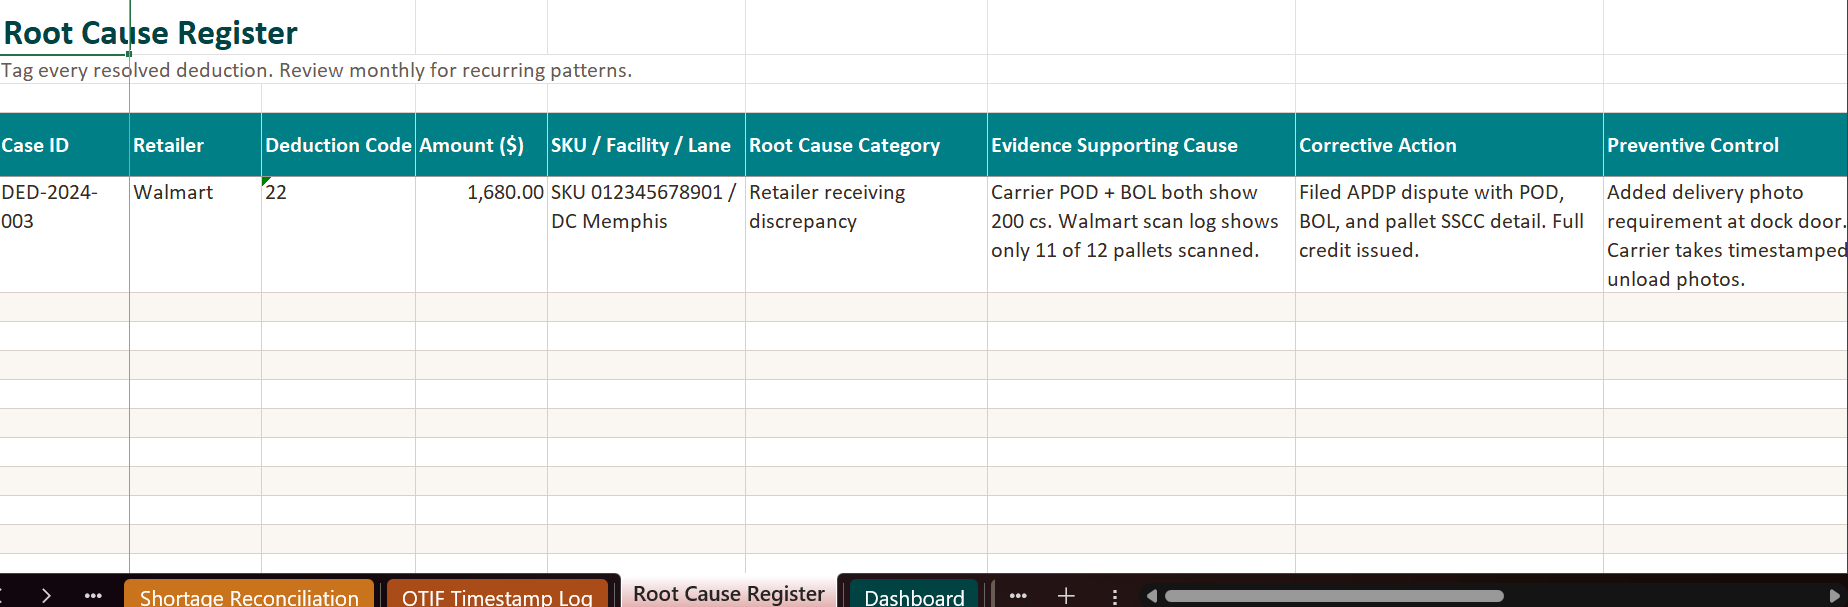
A recovered deduction is yesterday’s problem. A recurring deduction is a process failure you haven’t fixed yet. This sheet connects the two.
Columns
Case ID, Retailer, Deduction Code, Amount, SKU/Facility/Lane, Root Cause Category (dropdown), Evidence Supporting Cause, Corrective Action, Preventive Control, Owner, Date Identified, Due Date, Status (dropdown: Open, In Progress, Implemented, Verified, Closed), Recurrence (dropdown: Yes - recurring, Yes - new instance, No, Monitoring), and 30/60/90-Day Check columns.
Recurrence values that start with “Yes” show in red text.
How to use it
- After resolving a dispute (won, lost, or written off), add one row with the root cause.
- Assign an owner and a due date for the corrective action.
- Check the 30/60/90-day columns monthly. If the same root cause keeps appearing, the corrective action didn’t work.
- The Dashboard reads from this sheet to show root-cause frequency and total value by cause category.
Dashboard
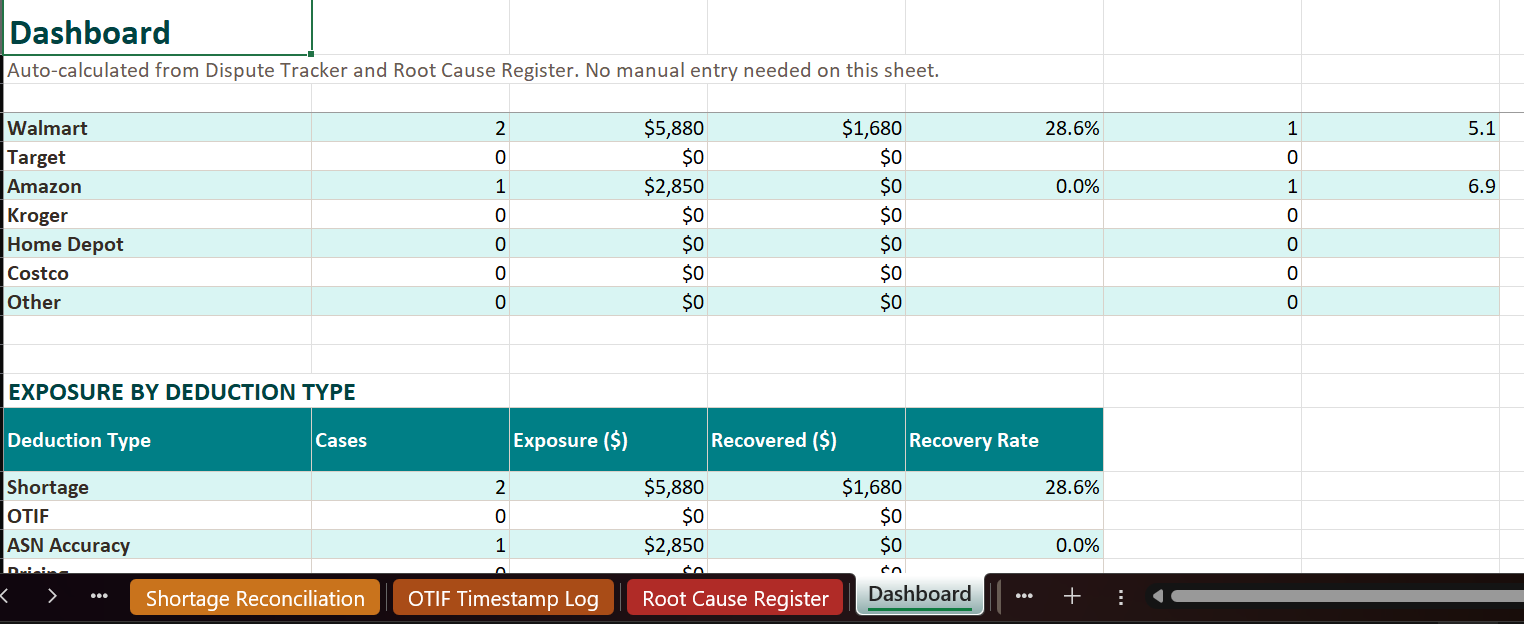
Don’t type in this sheet. Every cell is a formula that reads from the Dispute Tracker and Root Cause Register.
Portfolio summary
| Metric | What it shows |
|---|---|
| Total Deductions Logged | Count of non-empty Case IDs in the Dispute Tracker |
| Total Exposure | Sum of all deduction amounts |
| Total Recovered | Sum of all recovered amounts |
| Recovery Rate | Total Recovered divided by Total Exposure |
| Open Cases | Cases not yet marked Won, Lost, Written Off, or Partial |
| Overdue Cases | Cases where Days Remaining is negative. Turns red if any exist. |
| Cases Due in 7 Days | Cases with 0 to 7 days remaining |
| Cases Due in 30 Days | Cases with 0 to 30 days remaining |
| Average Priority Score | Mean of all calculated priority scores |
Recovery by retailer
One row per retailer: cases, exposure, recovered, recovery rate, open cases, and average priority score. Walmart, Target, Amazon, Kroger, Home Depot, Costco, and Other.
Exposure by deduction type
One row per type: cases, exposure, recovered, recovery rate. Shortage, OTIF, ASN Accuracy, Pricing, Compliance, Returns, and Other.
Root cause frequency
One row per root cause category: occurrences, total value, and percentage of all tagged causes. If “ASN timing/transmission” accounts for 40% of your deductions by value, that’s where your process improvement budget goes.
Outcome summary
Cases and amounts grouped by outcome: Won, Partial, Lost, Written Off, and Pending.
Deadline Reference
A static reference table compiled from Pixels and Clicks articles. Ten rows covering Walmart (four claim types), Target (three), Amazon (one), and Kroger (two).
Each row shows the reported dispute window, what date starts the clock, the portal or route to file through, a confidence note, and a hyperlink to the source article.
For the most current version, use the Deduction Dispute Deadline Lookup on the Pixels and Clicks site.
Google Sheets compatibility
Every formula uses standard spreadsheet functions. No Excel-only features.
| Feature | Excel | Google Sheets |
|---|---|---|
| Formulas (IF, COUNTIFS, SUMIFS, SUMPRODUCT, TODAY, etc.) | Works | Works, no changes needed |
| Data validation dropdowns | Works | Carries over from .xlsx upload |
| Conditional formatting (color-filled cells and colored text) | Works | May need manual re-application |
| Cross-sheet references | Works | Works |
| Number formats (currency, date, percentage) | Works | Works |
To use in Google Sheets:
- Upload the .xlsx file to Google Drive.
- Right-click the file. Select Open with, then Google Sheets.
- Check that the conditional formatting on the Dispute Tracker’s Days Remaining column (K) and Priority Score column (L) looks right. If the colors are missing, re-apply them manually: select the column, go to Format then Conditional formatting, and set the rules described in the Dispute Tracker section above.
Monthly review process
Open the Dashboard on the first Monday of each month and run five checks.
- Overdue cases. If Overdue Cases shows anything other than zero, those cases need immediate attention or a write-off decision.
- Recovery rate by retailer. A 20% recovery rate at one retailer and 70% at another means your evidence process for that retailer is broken. Check whether the Evidence Checklist completeness for that retailer’s cases was consistently low.
- Root cause concentration. If one root cause accounts for more than 30% of total deduction value, it’s a process failure worth a dedicated fix. A warehouse pick error that causes $50,000 in annual shortage claims justifies a pre-ASN quantity validation check.
- Type distribution. If shortage claims dominate your exposure, your operational focus is warehouse execution, carrier handoff, and receiving. If OTIF dominates, focus on appointment scheduling and ASN timing. The workbook tells you where the money is leaking.
- Aging. If Cases Due in 7 Days stays consistently above zero, your team is working too close to deadlines. Move dispute preparation earlier in your process.
Download
The workbook is free and ungated. Hit download.
Compatible with Excel 2016+ and Google Sheets. Upload the .xlsx to Google Drive and open with Google Sheets. See compatibility notes.
200 data rows per sheet. Need more? Select the last formula row, drag down.
If you want to understand the evidence chain behind each document type, read The Six Documents You Need Before Disputing a Deduction. For retailer-specific dispute windows, use the Deduction Dispute Deadline Lookup. To size your annual deduction leakage, try the Deduction-Leakage Calculator.
Three hubs cover the system this workbook plugs into. The Deduction Management hub walks through the full recovery cycle, from decoding a code to preventing the next one. The Supplier Scorecard hub explains the OTIF and ASN-accuracy metrics the Timestamp Log feeds. The Vendor Compliance hub covers the routing-guide rules behind most compliance chargebacks.
This workbook is an operational aid. Retailer programs, portal workflows, deadlines, and required evidence vary and change. Confirm current requirements in your retailer portal and supplier agreement before submitting a dispute.
Frequently Asked Questions
- Does the workbook work in Google Sheets?
- Yes. Every formula uses functions available in Google Sheets: IF, AND, OR, TODAY, COUNTIFS, SUMIFS, AVERAGEIFS, SUMPRODUCT, IFERROR, and ROUND. Upload the .xlsx file to Google Drive and open it with Google Sheets. Data validation dropdowns carry over. Conditional formatting colors may need manual re-application in some cases.
- What does the priority score measure?
- The priority score is a 0-to-10 scale combining three factors: deduction amount (weighted 30%), days remaining until deadline (weighted 40%), and evidence readiness (weighted 30%). A $5,000 deduction due in 3 days with incomplete evidence scores higher than a $500 deduction due in 60 days with all documents gathered. Use it to decide which cases to work first.
- How does the shortage reconciliation sheet work?
- Enter quantities at four handoff points: ordered (from the PO), picked (from the WMS), ASN'd (from the actual EDI 856), and received (from the retailer's record). The sheet auto-calculates the gap between each consecutive pair. A non-zero gap turns red. The First Divergence column tells you where to investigate: warehouse, ASN generation, carrier and delivery, or billing.
- What is the Dashboard sheet?
- The Dashboard auto-calculates from the Dispute Tracker and Root Cause Register. It shows total exposure, total recovered, recovery rate, overdue and upcoming cases, and breakdowns by retailer, deduction type, root-cause category, and outcome. Every cell is a formula. No manual entry required.
Find out what your deductions are actually costing you.
A 30-minute call with the founder, who will tell you which of the three scans fits your problem, or that none of them do.